Previous Day High Low Strategy only for LongWelcome to the "Previous Day High Low Strategy only for Long"!.
This strategy aims to identify potential long trading opportunities based on the previous day's high and low prices, along with certain market strength conditions.
Key Features:
Entry Conditions: The strategy triggers a long position when the current day's closing price crosses above the previous day's high or low.
Market Strength Filter: The strategy incorporates a market strength filter using the Average Directional Index (ADX). It only takes long positions when the ADX value is above a specific threshold and when there is a predominance of upward movement.
Trade Timing: The strategy operates within a specified trade window, starting at 09:30 and ending at 15:10. Positions are closed at 15:15 if still active.
Risk Management: The strategy employs dynamic stop-loss and profit-taking levels based on a user-defined Max Profit value. It has three profit targets (T1, T2, T3) and a stop-loss level to manage risk effectively.
Rules:
Ensure that the strategy idea is clearly understandable. Provide an easy-to-read title and a thoughtful description explaining the reasoning behind the strategy.
All content should be ad-free. Avoid any form of promotion, advertising, or solicitation.
No fundraising requests or money solicitation is allowed on TradingView.
Publish in the same language as the TradingView subdomain you're on, except for script titles, which must be in English.
Don't plagiarize. Create and share only unique content, and always give credit when using someone else's work.
Be respectful, kind, and constructive when engaging with others.
Zero tolerance for contentious political discourse, defamatory, threatening, or discriminatory remarks.
Avoid sharing harmful, misleading, or inappropriate content.
Respect the moderators' work and address complaints privately.
Use only your original account and avoid creating duplicate or fake accounts.
Do not attempt to manipulate the reputation system or engage in like-for-like schemes.
Explanation of how the strategy works
1. Previous Day's High and Low (HH, LL):
In this strategy, we start by obtaining the high and low prices of the previous day (not the current day) using the request.security function. This function allows us to access historical data for a specific time frame. The high and low prices are stored in the variables HH and LL, respectively.
2. Entry Conditions:
The strategy uses two conditions to trigger a long position:
Condition 1 (Long Condition 1): If the closing price of the current day crosses above the previous day's high (HH), it generates a long signal. This is achieved using the ta.crossover function, which detects when a crossover occurs.
Condition 2 (Long Condition 2): Similarly, if the closing price of the current day crosses above the previous day's low (LL), it also generates a long signal.
Combined Condition: To take long positions, the strategy combines both long conditions using the logical OR operator (or). This means that if either of the two conditions is met, a long position will be initiated.
3. Market Strength Filter:
The strategy also includes a filter based on the Average Directional Index (ADX) to gauge the market's strength before taking long positions. The ADX measures the strength of a trend in the market. The higher the ADX value, the stronger the trend.
Calculation of ADX: The ADX is calculated using the adx function, which takes two parameters: LWdilength (DMI Length) and LWadxlength (ADX period).
Strength Condition (strength_up): The strategy requires that the ADX value should be above a threshold (11 in this case) and that there is a predominance of upward movement (up > down) before initiating a long position. The LWADX value is multiplied by 2.5 and compared to the highest value of LWADX from the last 4 periods using ta.highest(LWADX , 4). If these conditions are met, the variable strength_up is set to true.
Combined Condition: The strength_up condition is then combined with the long conditions using the logical AND operator (and). This means that the strategy will only take a long position if both the long conditions and the market strength condition are met.
4. Trade Timing:
The strategy sets a specific trade window between 09:30 and 15:10. It will only execute trades within this time frame (TradeTime).
5. Risk Management:
The strategy implements dynamic stop-loss (SL) and profit-taking levels (T1, T2, T3) based on a user-defined Max Profit value. The stop-loss is set as a percentage of the Max Profit value. As the position moves in favor of the trader, the profit targets are adjusted accordingly.
6. Position Management:
The strategy uses the strategy.entry function to enter long positions based on the combined entry conditions. Once a position is open, the script uses strategy.exit to define the exit condition when either the profit target or stop-loss level is hit. The strategy.close function is used to close any open position at the end of the trade window (15:15).
7. Plotting:
The strategy uses the plot function to visualize the previous day's high and low prices, as well as the stop-loss (SL) and profit-taking (T1, T2, T3) levels on the chart.
Overall, the "Previous Day High Low Strategy only for Long" aims to identify potential long trading opportunities based on the previous day's price action and market strength conditions. However, as with any trading strategy, it's essential to thoroughly test it and consider risk management before applying it to real-world trading scenarios.
Disclaimer:
The information presented by this strategy is for educational purposes only and should not be considered as investment advice. The strategy is not designed for qualified investors. Always conduct your own research and consult with a financial advisor before making any trading decisions.
Remember, the success of any trading strategy depends on various factors, including market conditions, risk management, and individual trading skills. Past performance is not indicative of future results.
Cerca negli script per "Up down"

Support and Resistance Backtester [SS]Hey everyone,
Excited to release this indicator I have been working on.
I conceptualized it as an idea a while ago and had to nail down the execution part of it. I think I got it to where I am happy with it, so let me tell you about it!
What it does?
This provides the user with the ability to quantify support and resistance levels. There are plenty of back-test strategies for RSI, stochastics, MFI, any type of technical based indicator. However, in terms of day traders and many swing traders, many of the day traders I know personally do not use or rely on things like RSI, stochastics or MFI. They actually just play the support and resistance levels without attention to anything else. However, there are no tools available to these people who want to, in a way, objectively test their identified support and resistance levels.
For me personally, I use support and resistance levels that are mathematically calculated and I am always curious to see which levels:
a) Have the most touches,
b) Have provided the most support,
c) Have provided the most resistance; and,
d) Are most effective as support/resistance.
And, well, this indicator answers all four of those questions for you! It also attempts to provide some way to support and resistance traders to quantify their levels and back-test the reliability and efficacy of those levels.
How to use:
So this indicator provides a lot of functionality and I think its important to break it down part by part. We can do this as we go over the explanation of how to use it. Here is the step by step guide of how to use it, which will also provide you an opportunity to see the options and functionality.
Step 1: Input your support and resistance levels:
When we open up the settings menu, we will see the section called "Support and Resistance Levels". Here, you have the ability to input up to 5 support and resistance levels. If you have less, no problem, simply leave the S/R level as 0 and the indicator will automatically omit this from the chart and data inclusion.
Step 2: Identify your threshold value:
The threshold parameter extends the range of your support and resistance level by a desired amount. The value you input here should be the value in which you would likely stop out of your position. So, if you are willing to let the stock travel $1 past your support and resistance level, input $1 into this variable. This will extend the range for the assessment and permit the stock to travel +/- your threshold amount before it counts it as a fail or pass.
Step 3: Select your source:
The source will tell the indicator what you want to assess. If you want to assess close, it will look at where the ticker closes in relation to your support and resistance levels. If you want to see how the highs and lows behave around the S/R levels, then change the source to High or Low.
It is recommended to leave at close for optimal results and reliability however.
Step 4: Determine your lookback length:
The lookback length will be the number of candles you want the indicator to lookback to assess the support and resistance level. This is key to get your backtest results.
The recommendation is on timeframes 1 hour or less, to look back 300 candles.
On the daily, 500 candles is recommended.
Step 5: Plot your levels
You will see you have various plot settings available to you. The default settings are to plot your support and resistance levels with labels. This will look as follows:
This will plot your basic support and resistance levels for you, so you do not have to manually plot them.
However, if you want to extend the plotted support and resistance level to visually match your threshold values, you can select the "Plot Threshold Limits" option. This will extend your support and resistance areas to match the designated threshold limits.
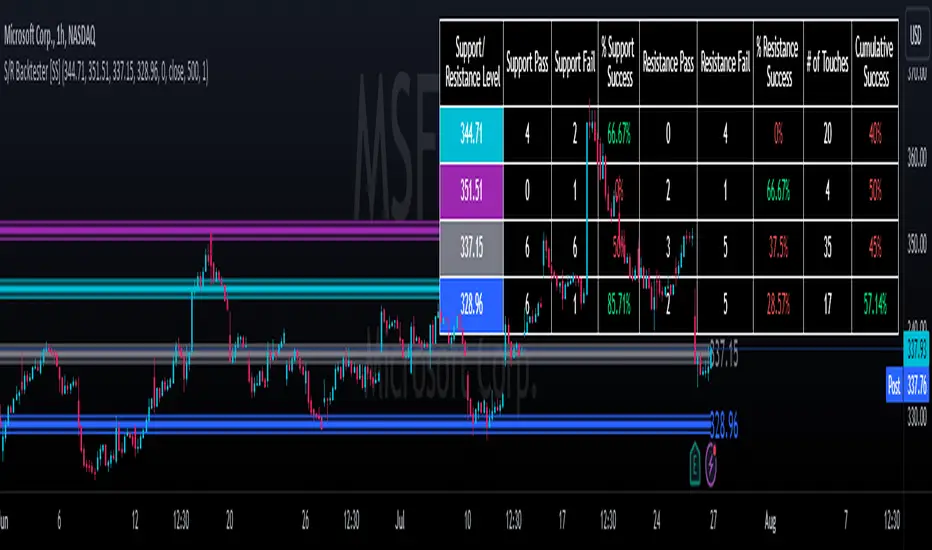
In this case on MSFT, I have the threshold limit set at $1. When I select "Plot Threshold Limits", this is the result:
Plotting Passes and Fails:
You will notice at the bottom of the settings menu is an option to plot passes and plot fails. This will identify, via a label overlaid on the chart, where the support and resistance failures and passes resulted. I recommend only selecting one at a time as the screen can get kind of crowded with both on. here is an example on the MSFT chart:
And on the larger timeframe:
The chart
The chart displays all of the results and counts of your support and resistance results. Some things to pay attention to use the chart are:
a) The general success rate as support vs resistance
Rationale: Support levels may act as resistance more often than they do support or vice versa. Let's take a look at MSFT as an example:
The chart above shows the 334.07 level has acted as very strong support. It has been successful as support almost 82% of the time. However, as resistance, it has only been successful 33% of the time. So we could say that 334 is a strong key support level and an area we would be comfortable longing at.
b) The number of touches:
Above you will see the number of touches pointed out by the blue arrow.
Rationale: The number of touches differs from support and resistance. It counts how many times and how frequently a ticker approaches your support and/or resistance area and the duration of time spent in that area. Whereas support and resistance is determined by a candle being either above or below a s/r area, then approaching that area and then either failing or bouncing up/down, the number of touches simply assesses the time spent (in candles) around a support or resistance level. This is key to help you identify if a level has frequent touches/consolidation vs other levels and can help you filter out s/r levels that may not have a lot of touches or are infrequently touched.
Closing comments:
So this is pretty much the indicator in a nutshell. Hopefully you find it helpful and useful and enjoy it.
As always let me know your questions/comments and suggestions below.
As always I appreciate all of you who check out, try out and read about my indicators and ideas. I wish you all the safest trades and good luck!
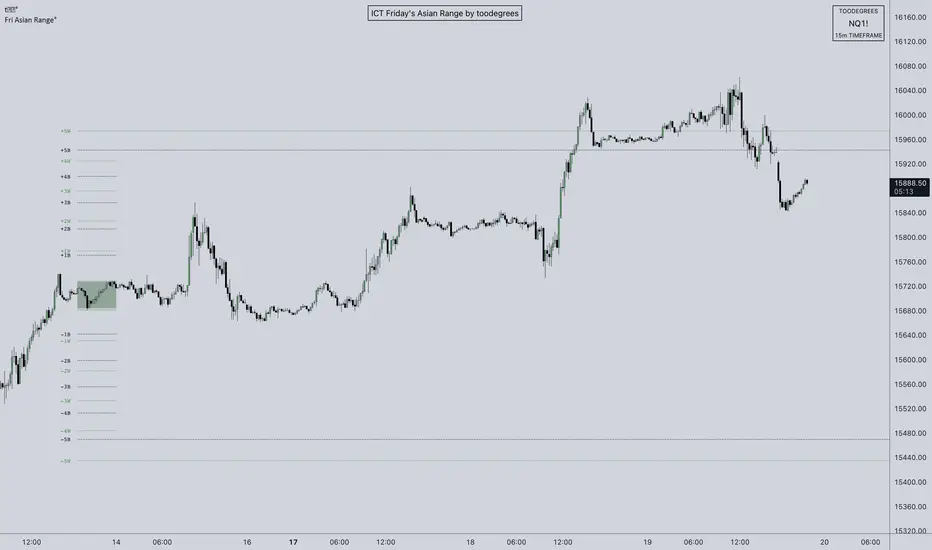
ICT Friday's Asian Range°This concept was engineered and taught by the Inner Circle Trader .
The goal of this script is to outline a potential draw on liquidity for the next trading week. It gives a parameter for ICT PD Arrays to be located above and below the marketplace and should be used in conjunction with the higher Timeframe Arrays as defined by ICT.
If there is a higher Timeframe array with a standard deviation confluence of the Friday Asian Range it is considered high probability for price to reach up/down to that level, and present a potential retracement or reversal.
The Asian Range is defined as the window of Time between 7PM to Midnight New York Time. In this case we will be only using the Friday's Asian Range which will take place on Thursday between these Times.
We have two ranges: a Body range made of the highest and lowest candle bodies, and a Wick range made by the highest and lowest candle wicks.
ICT teaches that we only want to apply this concept to the 5minute and 15minute chart.
THIS SCRIPT WILL NOT WORK ON ANY OTHER TIMEFRAME OUT OF THE BOX
Framework:
Visualization:
Example:
Price Legs: Average Heights; 'Smart ATR'Price Legs: Average Heights; 'Smart ATR'. Consol Range Gauge
~~ Indicator to show small and large price legs (based on short and long input pivot lengths), and calculating the average heights of these price legs; counting legs from user-input start time ~~
//Premise: Wanted to use this as something like a 'Smart ATR': where the average/typical range of a distinct & dynamic price leg could be calculated based on a user-input time interval (as opposed to standard ATR, which is simply the average range over a consistent repeating period, with no regard to market structure). My instinct is that this would be most useful for consolidated periods & range trading: giving the trader an idea of what the typical size of a price leg might be in the current market state (hence in the title, Consol Range gauge)
//Features & User inputs:
-Start time: confirm input when loading indicator by clicking on the chart. Then drag the vertical line to change start time easily.
-Large Legs (toggle on/off) and user-input pivot lookback/lookforward length (larger => larger legs)
-Small Legs (toggle on/off) and user-input pivot lookback/lookforward length (smaller => smaller legs)
-Display Stats table: toggle on/off: simple view- shows the averages of large (up & down), small (up & down), and combined (for each).
-Extended stats table: toggle on/off option to show the averages of the last 3 legs of each category (up/down/large/small/combined)
-Toggle on/off Time & Price chart text labels of price legs (time in mins/hours/days; price in $ or pips; auto assigned based on asset)
-Table position: user choice.
//Notes & tips:
-Using custom start time along with replay mode, you can select any arbitrary chunk of price for the purpose of backtesting.
-Play around with the pivot lookback lengths to find price legs most suitable to the current market regime (consolidating/trending; high volatility/ low volatility)
-Single bar price legs will never be counted: they must be at least 2 bars from H>>L or L>>H.
//Credits: Thanks to @crypto_juju for the idea of applying statistics to this simple price leg indicator.
Simple View: showing only the full averages (counting from Start time):
View showing ONLY the large legs, with Time & Price labels toggled ON:

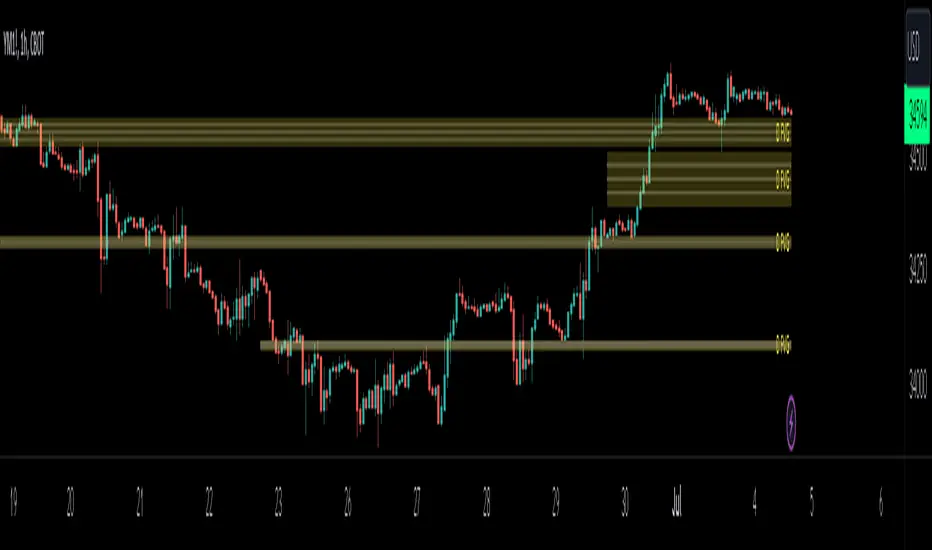
HTF FVG D/W/M 25%/50%/75% [MK]Do you use HTF FVG (fair value gaps) in your trading strategy? Do you monitor price on the 25%/50%/75% levels within the FVG on a lower timeframe?
This script will allow the user to display either Daily, Weekly or Monthly FVGs on a lower timeframe chart. The script will then also show the 25%/50%/75% levels within the HTF FVG so traders can see how price reacts in the FVG.
For example, a Weekly FVG may be chosen by the trader as a possible reversal point, or somewhere to add to an existing position. The trader might want to see the FVG almost fully filled, then watch price climb up/down out of the Weekly FVG
before taking the trade.
Previously traders would draw the FVG to the chart, then use maybe the tradingview fib tool to display the 25%/50%/75% levels. The problem with this is that its easy to accidently move the fib while dragging the chart around.
Chart below shows example of price almost filling a D FVG, then using the 25%/50%/75% levels as it climbs out of the FVG and reverses to the upside.
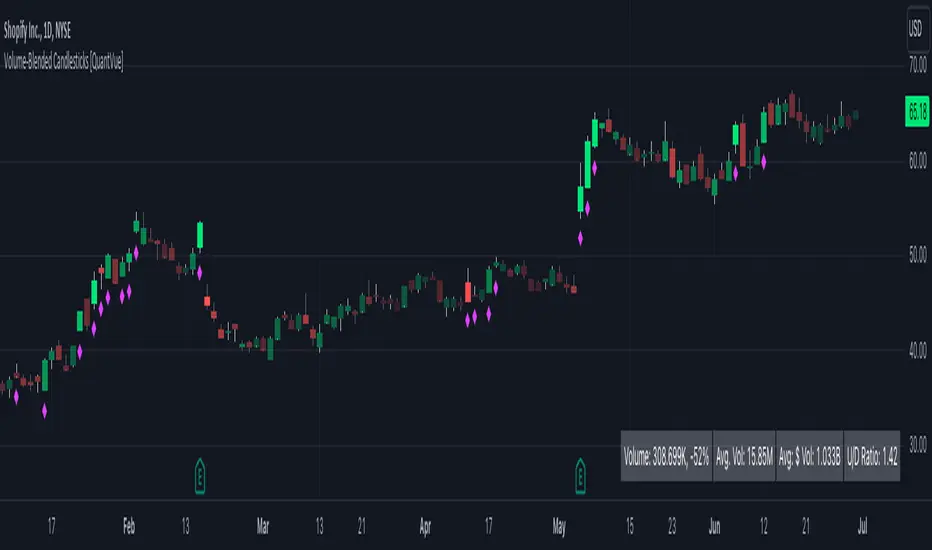
Volume-Blended Candlesticks [QuantVue]Introducing the Volume-Blended Candlestick Indicator, a powerful tool that seamlessly integrates volume information with candlesticks, providing you with a comprehensive view of market dynamics in a single glance.
The Volume-Blended Candlestick Indicator employs a unique approach of projecting volume totals by calculating the total volume traded per second and comparing it to the time left in the session as well as the historical average length selected by the user.
The indicator then dynamically adjusts the opacity of the candlestick colors based on the intensity of the projected volume. As volume intensifies, the candlestick colors become more pronounced, while low volume will cause colors to fade allowing you to visually perceive the level of buying or selling.
One of the standout features of the Volume-Blended Candlestick Indicator is its ability to identify pocket pivots. A pocket pivot is an up day with volume greater than any of the down days volume in the past 10 days. By highlighting these pocket pivots on your chart, the indicator helps you identify potential stealth accumulation.
In addition to blending volume with candlesticks and spotting pocket pivots, this versatile indicator provides you with an insightful table displaying key volume metrics. The table includes the average volume, average dollar volume, and the up-down volume ratio, allowing you to get a clear picture of buying and selling pressure.
Settings Include:
🔹Sensitivty Level: Normal, More, Less
🔹Volume MA Length
🔹Toggle Color based on previous close
🔹Show or hide volume info
🔹Chose candlestick colors
🔹Show or hide pocket pivots
🔹Show or hide volume info table
Don't hesitate to reach out with any questions or concerns.
We hope you enjoy!
Cheers.
Trendilo (OPEN-SOURCE)The provided code is a custom indicator called "Trendilo" in TradingView. It helps traders identify trends in price data. The indicator calculates the percentage change of the chosen price source and applies smoothing to it. Then, it calculates the Arnaud Legoux Moving Average (ALMA) of the smoothed percentage change. The ALMA is compared to a root mean square (RMS) band, which represents the expected range of the ALMA values. Based on this comparison, the indicator determines whether the trend is up, down, or sideways. The indicator line is plotted in a color corresponding to the trend direction. The indicator also provides the option to fill the area between the indicator line and the RMS band. Additionally, users can choose to color the bars of the chart based on the trend direction. Overall, the "Trendilo" indicator helps traders visually identify trends and potential reversals in the price data.
7 Closes above/below 5 SMAThis script looks for 7 consecutive closes above/below the 5-period SMA. The indicator is inspired by legendary trader Linda Raschke's work.
Usage
The script can can be used in three main ways. I think you will find more uses.
First are the two models for which the indicator was created, both inspired by Raschke:
1) Persistency of trend / Extended run setup.
Around 10-12 times per year we get a persistency of trend in instruments in general.
After 7 consecutive closes above/below the 5-period as price pulls back we can look to enter in the direction of the main trend as it moves up/down above/below 5 ma again. You should use price action trading to pinpoint the entries. Now try to hold this as long as possible. Way longer than you can percieve or think is possible. Up to 24-28 periods is what we are looking for in these cases.
2) Normal usage.
When the trend is not persistent, it is possible to use this as an oscillating signal, for a shorter term trade, where we can look for a short or long term reversal setup in price action.
3) I also use it at as a learning to see the swing trades clearer. You can also use it as a visual aid for developing new variances of the classic swing trading setup.
Read and listen to Linda Raschkes work to learn more.
TIme frames
The principles works in all time frames but may change depending on calendar differences. We will see more instances/year in shorter time frames.
Why closes above the 5 SMA
As you may or may not know the 5 SMA is a very important indicator. You can think of it like this, If price is above 5, it is innocent until proven guilty but if price is below 5 we use the french law system which means it is guilty until proven innocent. 7 closes above 5 is a very good predictor of possible short term direction changes.
Use together with:
I prefer to use this indicator together with either regular SMA:s, one short and one macro term. For example 10 ma and 100 ma.
Or you can use it with a a Hull 21-period MA together with a 240-period WMA.
Settings:
I added settings so you can change preferences for changing shape, where to display the shape and in what color
Visual aid
I wanted to keep one dot for each consecutive day, this way we will get a grouping of days and dots. The amount in this group can be of use in itself to inform you of the strength of trend. This can inform you if this oscillation predicts a short term eversal or a continuation. You need skills in reading price action to use this to your advantage.

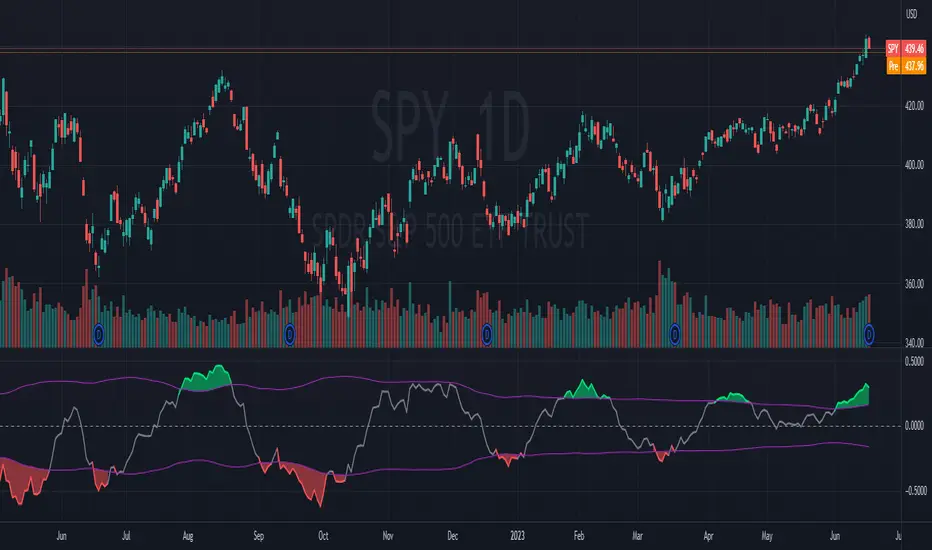
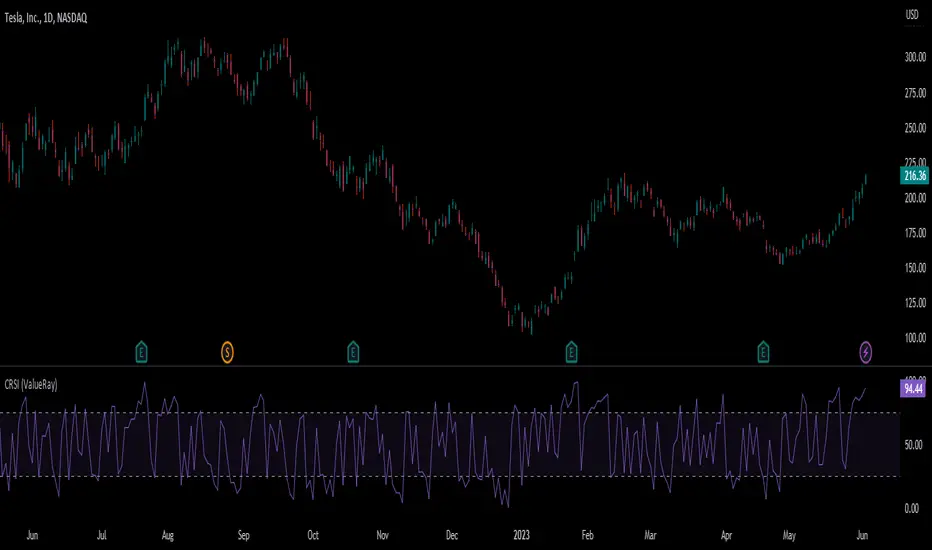
Connors RSI (ValueRay)In compare to Tradingview Connors RSI, in this one you can choose which of the parts of the CRSI you want see:
RSI
Connors RSI
Up/Down RSI
Percent Rank
The Connors RSI is a technical indicator developed by Larry Connors. It combines three different elements - price momentum, relative strength, and mean reversion - to identify potential buy and sell signals. The indicator measures the level of overbought or oversold conditions in a security, aiming to generate signals for short-term trading opportunities. It is widely used by traders to assess the strength and direction of price movements and to identify potential entry and exit points in the market.
Intraday Intensity ModesIntraday Intensity Index was created by David Bostian and its use was later featured by John Bollinger in his book "Bollinger on Bollinger Bands" . It is categorically a volume indicator and considered to be a useful tool for analyzing supply and demand dynamics in the market. By measuring the level of buying and selling pressure within a given trading session it attempts to provide insights into the strength of market participants' interest and their aggressiveness in executing trades throughout the day. It can be used in conjunction with Bollinger Bands® or other envelope type indicators as a complimentary indicator to aid in trying to identify potential turning points or trends.
Intraday intensity is calculated based upon the relationship between the price change and the volume of shares traded during each daily interval. It aims to capture the level of buying or selling activity relative to the overall volume. A high intraday intensity value suggests a higher level of buying or selling pressure, indicating a more active and potentially volatile market. Conversely, a low intraday intensity value indicates less pronounced trading activity and a potentially quieter market. Overall, intraday intensity provides a concise description of the intensity of trading activity during a particular trading session, giving traders an additional perspective on market dynamics. Note that because the calculation uses volume this indicator will only work on symbols where volume is available.
While there are pre-existing versions within community scripts, none were found to have applied the calculations necessary for the various modes that are presented within this version, which are believed to be operating in the manner originally intended when first described by Bostian and again later by Bollinger. When operating in default modes on daily or lower chart timeframes the logic used within this script tracks the intraday high, low, close and volume for the day with each progressing intraday bar.
The BB indicator was included on the top main chart to help illustrate example usage as described below. The Intraday Intensity Modes indicator is pictured operating in three different modes beneath the main chart:
• The top pane beneath the main chart shows the indicator operating as a normalized 21 day II% oscillator. A potential use while in this mode would be to look for positive values as potential confirmation of strength when price tags the upper or lower Bollinger bands, and to look for negative values as potential confirmation of weakness when price tags the upper or lower Bollinger bands.
• The middle pane shows the indicator operating as an "open ended" cumulative sum of II. A potential use while in this mode would be to look for convergence or divergence of trend when price is making new highs or lows, or while price is walking the upper or lower Bollinger bands.
• The bottom pane shows the indicator operating in standard III mode, which provides independent values per session.
Indicator Settings: Inputs tab:
Osc Length : Set to 1 disables oscillation, values greater than 1 enables oscillation for II% (Intraday Intensity percent) mode.
Tootip : Hover mouse over (i) to show recommended example Settings for various modes.
Cumulative : When enabled values are cumulatively summed for the entire chart and indicator operates in II mode.
Normalized : When enabled a rolling window of Osc Length values are summed and normalized to the rolling window's volume.
Intrabar : When enabled price range and volume are evaluated for intensity per bar instead of per day which is a departure from the original
concept. Whenever this setting is enabled the indicator should be regarded as operating in an experimental mode.
Colors For Up Down : Sets the plot colors used, may be overridden in Settings:Style tab.
Styles / Width : Sets the plot style and width used, may be overridden in Settings:Style tab.
This indicator is designed to work with any chart timeframe, with the understanding that when used on timeframes higher than daily the indicator becomes "IntraPeriod" intensity, for example on weekly bars it would be "IntraWeek" intensity. On Daily or lower timeframes the indicator operates as "IntraDay" intensity and is being updated on each bar as each day progresses. If the experimental setting Intrabar is enabled then the indicator operates as "IntraBar" intensity and is no longer constrained to daily or higher evaluations, for example with Intrabar enabled on a 4H timeframe the indicator would operate as "Intra4H" intensity.
NOTICE: This is an example script and not meant to be used as an actual strategy. By using this script or any portion thereof, you acknowledge that you have read and understood that this is for research purposes only and I am not responsible for any financial losses you may incur by using this script!

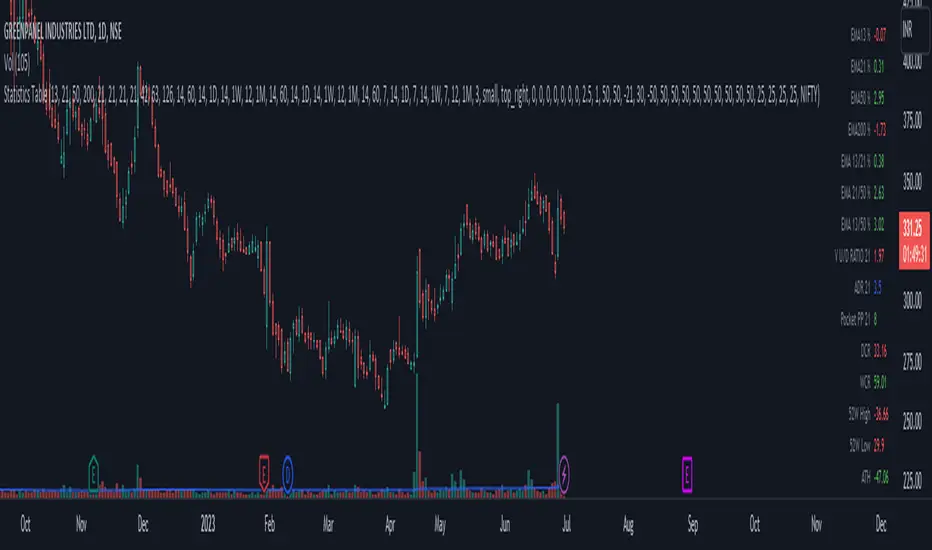
Statistics TableThis script display some useful Statistics data that can be useful in making trading decision.
Here the list of information this script is display in table format.
You can change each and every single ema and rs length as per your need from setting.
1) close difference from first ema
2) close difference from second ema
3) close difference from third ema
4) close difference from fourth ema
5) difference between first and second ema
6) difference between second and third ema
7) difference between first and third ema
8) volume up down ratio
9) ATR/ADR %
10) volume pocket pivot count
11) daily closing range
12) weekly closing range
13) close difference from 52week high
14) close difference from 52week low
15) close difference from All time high
16) close difference from All time low
17) rs line above or below first rs ema
18) rs line above or below second rs ema
19) rs line above or below third rs ema
20) rs line above or below fourth rs ema
21) first rs value
22) second rs value
23) third rs value
24) fourth rs value
25) difference between previous first rs length days change % and current first rs length days change %
26) difference between previous second rs length days change % and current second rs length days change %
27) difference between previous third rs length days change % and current third rs length days change %
Vollinger BandsI'm happy to present to you... VOLLINGER BANDS. Loosely based on bollinger bands, this indicator uses the new Up/Down Volume indicator from tradingview, which I have add moving averages, and a width calculation between them to determine squeeze. Essentially I have created a volume squeeze bollinger band derivative, hence the term "Vollinger Band".
The bands are NOT a deviation of any middle line or moving average, but rather their own moving averages of the volume delta, respectively.
Blue background = Volume Squeeze (vollinger bands width is less than the squeeze strength line), meaning consolidation, and a big move may happen soon.
Top line = A moving average of the Up Volume delta
Bottom line = A moving average of the Down Volume delta
Vol MA = the moving average length of both the top/bottom line
> If you zoom in, you can see a white line, which is the squeeze represented as a single line, calculated using bollinger bands width. The squeeze strength is a moving average of the squeeze line, which then determines if the width is below that moving average, then the squeeze will occur (white line below purple)
The bands are colored based on the sum of the Up/Down volume over the specified number of bars (preset at 5). If the volume is more buying than selling over that amount of bars, then the line is colored green, and vice versa.

Boftei's StrategyI wrote this strategy about a year ago, but decided to publish it just now. I have not been able to implement this strategy in the market. If you can, then I will be happy for you.
This strategy is based on my "Botvenko Script". (It finds the difference between the logarithms of closing prices from different days.) (Check this script in my profile)
Then the strategy makes trades when the "Botvenko Script" indicator crosses the levels set earlier and manually selected for each currency pair/shares: long/short opening/closing levels, long/short re-entry levels. (They are drawn with horizontal dotted lines.) The names of these lines are: buy/sell level, long/short retry - too low/high, long close up/down, dead - close the short. Manual selection of each of the parameters provides a qualitative entry of the strategy into the deal. However, without restraining mechanisms, the strategy enters into rather controversial deals. In order to avoid going long/short during bear/bull markets, which is unacceptable, I added a fan of EMA lines.
The fan consists of several EMA lines, which are set according to Fibonacci numbers (21, 55, 89, 144). If the lines in the fan are arranged in ascending order (ema_21>ema_55 and ema_55>ema_89 and ema_89>ema_144), then this indicates a bull market, during which I banned shorting. And vice versa: during the bear market (ema_21

Volume / Open Interest "Footprint" - By LeviathanThis script generates a footprint-style bar (profile) based on the aggregated volume or open interest data within your chart's visible range. You can choose from three different heatmap visualizations: Volume Delta/OI Delta, Total Volume/Total OI, and Buy vs. Sell Volume/OI Increase vs. Decrease.
How to use the indicator:
1. Add it to your chart.
2. The script will use your chart's visible range and generate a footprint bar on the right side of the screen. You can move left/right, zoom in/zoom out, and the bar's data will be updated automatically.
Settings:
- Source: This input lets you choose the data that will be displayed in the footprint bar.
- Resolution: Resolution is the number of rows displayed in a bar. Increasing it will provide more granular data, and vice versa. You might need to decrease the resolution when viewing larger ranges.
- Type: Choose between 3 types of visualization: Total (Total Volume or Total Open Interest increase), UP/DOWN (Buy Volume vs Sell Volume or OI Increase vs OI Decrease), and Delta (Buy Volume - Sell Volume or OI Increase - OI Decrease).
- Positive Delta Levels: This function will draw boxes (levels) where Delta is positive. These levels can serve as significant points of interest, S/R, targets, etc., because they mark the zones where there was an increase in buy pressure/position opening.
- Volume Aggregation: You can aggregate volume data from 8 different sources. Make sure to check if volume data is reported in base or quote currency and turn on the RQC (Reported in Quote Currency) function accordingly.
- Other settings mostly include appearance inputs. Read the tooltips for more info.

X48 - Strategy | BreakOut & Consecutive (11in1) + Alert | V.1.2================== Read This First Before Use This Strategy ==============
*********** Please be aware that this strategy is not a guarantee of success and may lead to losses.
*********** Trading involves risk and you should always do your own research before making any decisions.
================= Thanks Source Script and Explain This Strategy ===================
► Description
Write a detailed and meaningful description that allows users to understand how your script is original, what it does, how it does it and how to use it
This Strategy Are Combine Strategy and Indicators Alert Function For Systematic Trading User.
Strategy List, Thanks For Original Source Script , From Tradingview Build-in Script From fmzquant Github
// Channel BreakOut Strategy : Calculate BreakOut Zone For Buy and Sell.
// Consecutive Bars UP/Down Strategy : The consecutive bars up/down strategy is a trading strategy used to identify potential buy and sell signals in the stock market. This strategy involves looking for a series of bars (or candles) that are either all increasing or all decreasing in price. If the bars are all increasing, it can be a signal to buy, and if the bars are all decreasing, it can be a signal to sell. This strategy can be used on any timeframe, from a daily chart to an intraday chart.
// 15m Range Length SD : Range Of High and Low Candle Price and Lookback For Calculate Buy and Sell.
Indicators Are Simple Source Script (Almost I'm Chating With CHAT-GPT and Convert pinescript V4 to V5 again for complete almost script and combine after)
// SwingHigh and SwingLow Plot For SL (StopLoss by Last Swing).
// Engulfing and 3 Candle Engulfing Plot.
// Stochastic RSI for Plot and Fill Background Paint and Plot TEXT For BULL and BEAR TREND.
// MA TYPE MODE are plot 2 line of MA Type (EMA, SMA, HMA, WMA, VWMA) for Crossover and Crossunder.
// Donchian Fans MODE are Plot Dot Line With Triangle Degree Bull Trend is Green Plot and Bear Trend is Red Plot.
// Ichimoku Cloud Are Plot Cloud A-B For Bull and Bear Trend.
// RSI OB and OS for TEXT PLOT 'OB' , 'OS' you will know after OB and OS, you can combo with other indicators that's make you know what's the similar trend look like?
// MACD for Plot Diamond when MACD > 0 and MACD < 0, you can combo with other indicators that's make you know what's the similar trend look like?
Alert Can Alert Sent When Buy and Sell or TP and SL, you can adjust text to alert sent by your self or use default setting.
========== Let'e Me Explain How To Use This Strategy =============
========== Properties Setting ==========
// Capital : Default : 1,000 USDT For Alot Of People Are Beginner Investor = It's Capital Your Cash For Investment
// Ordersize : Default Are Setting 5% / Order We Call Compounded
========== INPUT Setting ==========
// First Part Use Must Choose Checkbox For Use of Strategy and Choose TP/SL by Swing or % (can choose both)
// In Detail Of Setting Are Not Too Much, Please Read The Header Of Setting Before Change The Value
// For The Indicator In List You Want To Add Just Check ✅ From MODE Setting, It's Show On Your Chart
// You Can Custom TP/SL % You Want
========== ##### No trading strategy is guaranteed to be 100% successful. ###### =========
For Example In My Systematic Trading
Select 1/3 Strategy Setting TP/SL % Match With Timeframe TP Long Are Not Set It's Can 161.8 - 423.6% but Short Position Are Not Than 100% Just Fine From Your Aset
Choose Indicators For Make Sure Trend and Strategy are the same way like Strategy are Long Position but MACD and Sto background is bear. that's mean this time not open position.
Donchian Fans is Simple Support and Ressistant If You Don't Know How To Plot That's, This indicator plot a simple for you ><.
Make Sure With Engulfing and 3 Candle Engulfing If You Don't Know, What's The Engulfing, This Indicator are plot for you too ><.
For a Big Trend You can use Ichimoku Cloud For Check Trend, Candle Upper Than Cloud or Lower Than Cloud for Bull and Bear Trend.

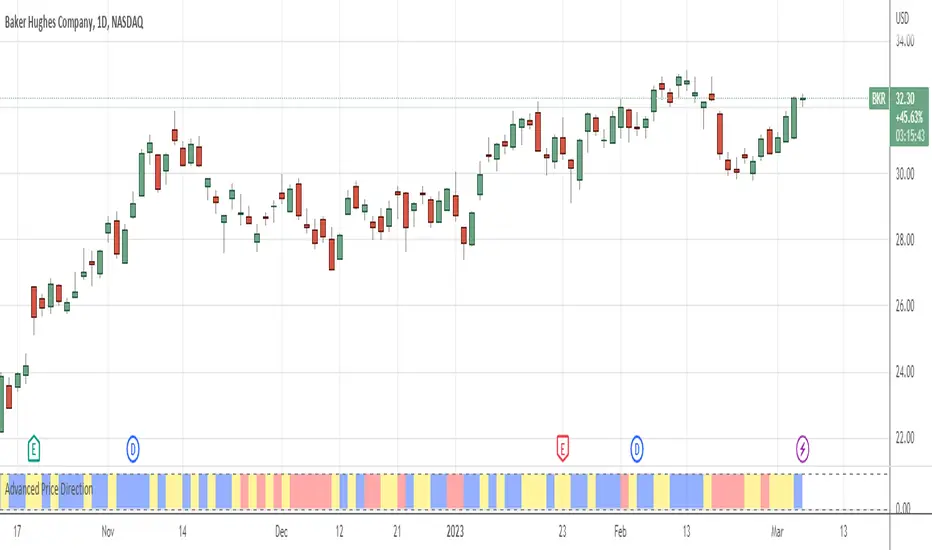
Advanced Price Direction AlgorithmPrices can go up or down or falter in their movement.
This code evaluates this by looking at two consecutive bars or sets of bars.
If you put the set size to 1, the current and previous bar is evaluated.
If put to 2, the last2 and the 2 before these are evaluated.
Default is 12 because this seems to coincide with trend changes.
This code provides an advanced way to evaluate what the price does in a sort of three-value Boolean with the values up, down or falter.
I use this code in indicators I develop where price direction is taken into account.
The simple output makes it possible to use it as an indicator on its own.
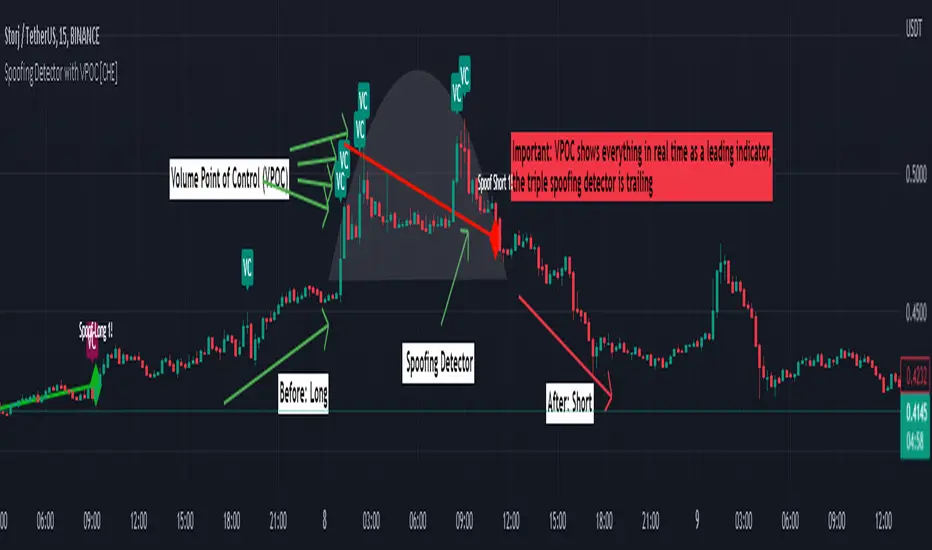
Spoofing Detector with VPOC [CHE]"We're keeping an eye on the market makers, zooming in for a closer look."
Spoofing and Volume Point of Control (VPOC) are terms used in the context of market manipulation and market analysis in financial markets.
A spoofing detector is a tool developed to detect the spoofing of orders. Spoofing refers to a practice where a market participant places large orders to deceive other market participants and influence the price of a stock. These large orders, however, are not executed but cancelled shortly after, creating a false demand for a specific stock and influencing the price. A spoofing detector can use algorithms to detect and report these practices to maintain the integrity of the market.
The Volume Point of Control (VPOC) is a concept in technical analysis aimed at identifying the key price level at which a stock was bought and sold. VPOC is calculated by analyzing the volume data of a stock and determining the price level at which the largest volume was traded for a specific period. This price level can serve as an indicator of the current market trend and market interest in a specific stock.
There is a substantive connection between a spoofing detector and VPOC because both tools can be used to gain a better understanding of the stock markets and detect potential forms of market manipulation. For example, VPOC can be used as an indicator of potential market manipulation when an abnormal distribution of trading volume is observed at a specific price level. A spoofing detector can then be used to detect and report these activities.
Pine Script Indicator Analysis:
This is a Pine Script code for a spoofing detector and volume point of control (VPOC) indicator. The purpose of the indicator is to detect and highlight potential spoofing activities in the market, as well as to plot the volume point of control on the chart.
Inputs:
Median Lookback: This input defines the length of the median calculation, with a default value of 25.
Range To Edges Threshold: This input sets a threshold value for the range to edges calculation, with a default value of 200.
Multiplier 1: This input sets a multiplier value to be used in the average true range calculation, with a default value of 0.8.
Multipler 2: This input sets a multiplier value to be used in the average true range calculation, with a default value of 2.0.
Multipler 3: This input sets a multiplier value to be used in the average true range calculation, with a default value of 3.0.
Variables:
y, x, ds, os: These are arrays and a variable used for the first part of the spoofing detection process.
y1, x1, ds1, os1: These are arrays and a variable used for the second part of the spoofing detection process.
y2, x2, ds2, os2: These are arrays and a variable used for the third part of the spoofing detection process.
Calculation:
The code starts by defining some variables, such as the bar index (n), the close price (src), and the average true range (atr) with different multipliers.
Next, the median of the close price is calculated over the lookback period specified by the "Median Lookback" input.
Then, the difference between the current median and the previous median is calculated, and the value is compared with the average true range with different multipliers to determine the state of the market (up, down, or unchanged).
The code then checks if the state has changed from the previous bar, and if so, the code performs a spoofing detection calculation.
The spoofing detection calculation involves determining the range between the first and last bar in the median calculation, and dividing it by the sum of the absolute differences calculated earlier. If the result is below the "Range To Edges Threshold" input, the code plots a line and a label on the chart indicating a potential spoofing activity.
The process is repeated for each of the three parts of the spoofing detection process.
VPOC:
The VPOC code is used to calculate the Volume Point of Control (VPOC) on a chart. The VPOC is the price level with the highest volume over a specified lookback period. The script contains several functions and inputs that allow the user to customize the calculation.
Inputs:
i_source: This input allows the user to specify the source for the VPOC price calculation. The options are the close price of the bar.
i_vpocThreshold: This input allows the user to set the threshold percentage for the VPOC highlight.
Functions:
timeStep_translate(): This function returns a string representing the time step of the lower time frame based on the current time frame of the chart.
ltfStats(): This function returns an array of the source and volume of the lower time frame.
ltfSrc, ltfVolume: This line requests the lower time frame data using the request.security_lower_tf function, with the lower time frame step calculated by the timeStep_translate() function.
maxVolume and indexOfMaxVolume: These variables store the maximum volume value and its corresponding index in the ltfVolume array.
maxVol: This variable stores the source value corresponding to the maximum volume.
vpocThresholdMet: This variable is a boolean that is true when the volume at the maximum volume price level is greater than or equal to the threshold percentage of the total volume.
vpocColor: This variable stores the color for the VPOC plot.
vh: This variable stores the highest volume in the lookback period.
plotshape(): This function plots the VPOC on the chart. The shape will be plotted only if the volume is greater than the specified threshold percentage of the highest volume in the lookback period. The shape will be labeled with the text "VC".
Overall, this script calculates the VPOC for a chart by aggregating volume data from a lower time frame and plotting a shape at the price level with the highest volume. The user can specify the source for the VPOC calculation and the threshold percentage for the VPOC highlight.
Important: VPOC shows everything in real time as a leading indicator, the triple spoofing detector is trailing
Best regards
Chervolino
VolumeFlowVolume & price have a direct correlation with each other. If the fundamental value changes, the price changes and volume follows. If the technicals change, volume changes and price follows.
Because the relationship between volume and price is so connected, I created a script highlighting important volume flow measurements.
The VolumeFlow indicator combines several volume measurements into 1 indicator.
1) Volume net inflow / outflow
2) Volume total flow change
3) Volume cumulation flow
The VolumeFlow indicator uses a scale from 100 high to -100 low, with the zero level being neutral.
The VolumeFlow indicator has 4 inputs:
1) +Volume-
2) VolumeFast
3) VolumeSlow
4) Accum/Dist
Default inputs:
+Volume-
length = 1, color = + green or - red
VolumeFast
length = 2, color = blue
VolumeSlow
length = 3, color = white
Accum/Dist
length = 5, color = brown
Horizontal lines
length = 100, 50, 0, -50, -100, color = white
* The VolumeFlow indicator uses altered pieces of code from my Options360 FibVIP indicator, Tradingview "Up / down volume" indicator and Tradingview "Accumulation/Distribution" indicator. *

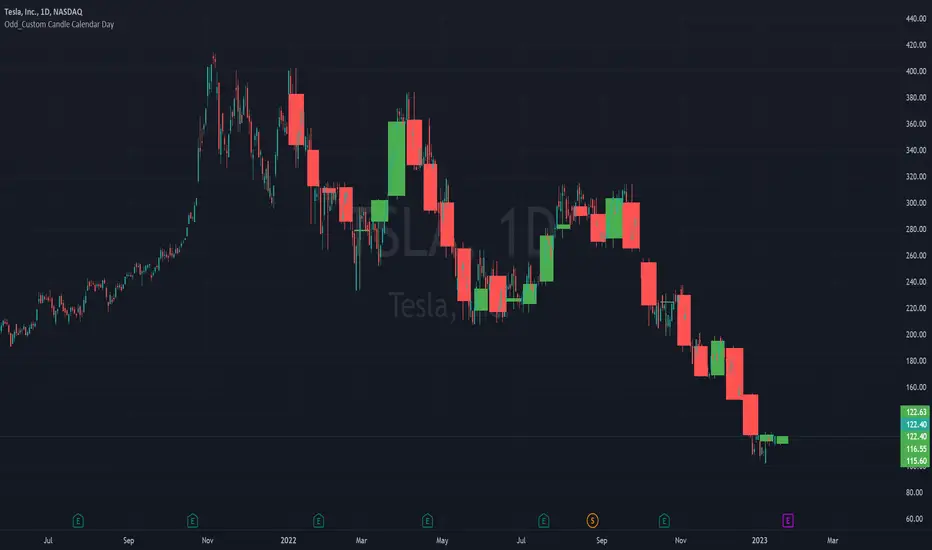
Odd_Custom Candle Calendar DayEver wonder how candles would look on a chart if they were tracked by calendar day instead of market days?
Option(s)-
📅Custom start date for candle formation
✖️Candle multiplier
🌈Up / Down Colors
Features-
📋Displays candle data with invisible plots
Use Move to Existing Pane to Overlay on chart.
Can only display a max of 500 candles!
Simple STRAT Tool by nnamWhat this Indicator Does
This indicator is a very simple tool created specifically for experienced Straters. It was created for those Straters who fully understand the 1-2-3 Strat Scenarios, are in need of an easy to use tool, and do not want or need a lot of messy markings on their chart.
The indicator simply allows the user to color code the Strat 1, 2 ,3 (Inside /Outside /Up / Down) Bars as desired and by default extends lines to the right of the chart from the Highs and Lows of the previous 2 Bars giving the user a simple reference for Strat scenario structure breaks.
As shown above, the bars are color coded, but the original bar color is maintained via the border and wick.
If a bar is an Outside Bar or an Inside Bar, it is still easy to identify whether or not the bar was a Bullish or Bearish 1 or 3.
The same goes for 2UP and 2Down Bars - It is easy to identify Bullish or Bearish UP or DOWN Bars.
Optionally, as show in the screenshot below, the user can extend the lines in both directions to get an "at a glance" better understanding of where price is currently vs previous support and resistance areas.
For Straters that prefer to trade only INSIDE BAR BREAKOUTS there is an optional input setting labeled "Trade Inside Bars ONLY".
This setting turns OFF the lines that extend from the 2nd previous bar back and only displays and extend lines from the previous bar IF and ONLY IF the current bar is an INSIDE (one) bar. .
The User Input settings allow for the following customizations:
1. Custom Outside Bar Color
2. Custom Inside Bar Color
3. Custom 2 Up Bar Color
4. Custom 2 Down Bar Color
5. Turn ON or OFF color coded bars
6. Trade only INSIDE Bar Breakouts
7. Extend Lines Both Directions
8. Hide all Lines
The customizable settings above allow the user to hide all lines and turn OFF color coding without having to fully remove the indicator from the chart. This is convenient when the user has another indicator that uses color coded bars or the lines conflict with another indicator and they need to be temporarily disabled.
If you have any questions regarding this indicator please let me know. If you have any suggestions for minor tweaks to the indicator do not hesitate to ask for them.
I hope you enjoy this indicator and get some usefulness from it... HAPPY TRADING!!
FOREX MASTER PATTERN Value Lines by nnamThe Forex Master Pattern is form of technical analysis that provides a framework for spotting hidden price patterns that reveal the true movement of the market. The Forex Master Pattern Value Lines Indicator helps to identify this Phase 1 contraction of the Forex Master Pattern cycle.
HOW THIS INDICATOR WORKS
This indicator looks for a sustained contraction in price initially indicated by TWO contraction bars in a row, thus detecting a contraction point and a potential new master pattern origin point.
Once a contraction point is detected, a blue box will appear on the chart with a thick solid blue line projecting from its center. These are potential "Points of Origin" and "Value Lines" that institutional traders use to balance their books.
As shown above, when price begins to move (detected by engulfing and/or expansion candles), an Arrow is plotted to the chart identifying a possible expansion.
As shown above, previous Value Lines typically serve as future support / resistance points, however, due to the unique location of these lines, they are not typically identified as support or resistance levels on standard S/R indicators.
Color Coded Candles assist the user in quickly identifying contraction and expansion areas as well as trends away from the value-line. The expansion candles, Up/Down candles, and contraction BARS are all inspired by the STRAT (Rob Smith) and are specifically incorporated into this indicator to assist the user in finding potential reversals during the expansion phase. This helps to avoid the whiplash typically associated with the first phase of Forex Master Pattern.
USER DEFINED SETTINGS
- Line Settings Section -
#Max Lines to Show
This limits or extends the total number of lines shown on the chart. The Default is 12 (minimum is 1, maximum is 499).
#Show Lines on Chart
This setting turns all lines ON or OFF on the chart
#Show Value-Lines on Chart
This setting turns the Value Lines ON or OFF on the chart
#Set Value-Line Width
This setting sets the width of the value-line displayed on the chart
#Only show last value-line on the chart
This setting removes all but the most recent value-line from the chart
- Box Settings Section -
#Show Last Box Only
This setting turns OFF all previous boxes and only shows the most recent contraction box on the chart
- Expansion Area Settings Section -
#Show Expansion Area
This setting turns ON or OFF the expansion area fill
#Show Expansion Guidelines on Chart
This setting turns ON or OFF the guidelines that show the current direction of the price via an extended line.
- Candle Colors Section -
#Color Code the Candles
This setting turns on Color Coding for the Candles which changes the colors of each candle type:
1. Contraction Candle
2. Expansion Candle
3. Up Candle
4. Down Candle
5. Engulfing Candles (engulfing candles override other candle settings if turned ON)
- Engulfing Patterns Section -
#Show Engulfing Patterns
This setting turns ON or OFF engulfing candle plots globally
#Show Bullish Engulfing Candles
This setting allows the user to turn Bullish Engulfing signals ON or OFF
#Show Bearish Engulfing Candles
This setting allows the user to turn Bearish Engulfing signals ON or OFF
I hope you enjoy this indicator and that it provides some value. Please reach out to me with any suggestions or need training on the indicator.

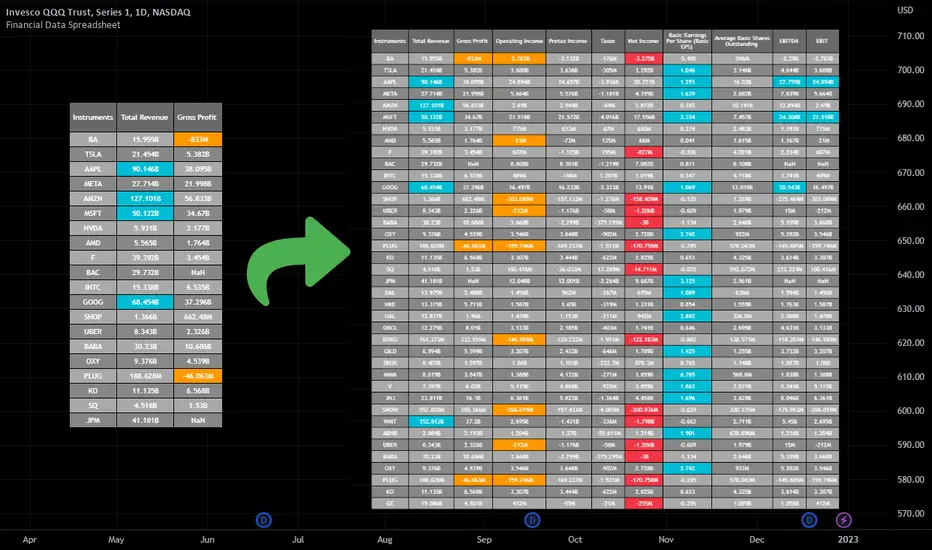
Financial Data Spreadsheet [By MUQWISHI]The Financial Data Spreadsheet indicator displays tables in the form of a spreadsheet containing a set of selected financial performances of a company within the most recent reported period. Analyzing Financial data is one of the classic methods to evaluate whether the company’s stock price is overvalued or undervalued based on its income statement, balance sheet, and cash flow statement. This indicator might be practical to investors to collect needed data of a company to analyze and compare it with other companies on a TradingView chart or print it in spreadsheet form.
█ OVERVIEW
█ BEST PRACTICES
Due to strict limitations on calling request.financial() function, I tried to develop the table with the best ways to be more dynamic to move and the ability to join multiple tables into a spreadsheet. Users can add up to 20 instruments and 2 financial metrics per table. However, it’s possible to add many tables with other financial metrics, then connect them to the main table.
Credits: The idea of joining multiple tables inspired by @QuantNomad Screener for 40+ instruments
█ INDICATOR SETTINGS
1- Moving Table toward right-left up-down from its origin.
2- Hiding Column Title checkmark. Useful for adding a joined table underneath with additional instruments.
3- Hiding Instruments Title checkmark. Useful for adding a joined table on the right with other financial metrics.
4- Shade Alternate Rows checkmark. I believe it’ll make the table easier to read.
5- Selecting Financial Period. (Year, Quarter).
6- Entering a currency.
7- Choosing a financial ID for each column. There’re over 200 financial IDs. Source: What financial data is available in Pine? — TradingView
8- Optional to highlight values in between.
9- Entering the ticker’s symbol with the ability to activate/deactivate.
█ TIP
For best technical performance, use the indicator in a 1D timeframe.
Please let me know if you have any questions.
Thank you.
Relative Strength against IndexThis is a very simple script to compare the performance of a single stock against its index, by adding / subtracting points for particular price action on up /down - days in the index.
For instance: If the index is down <-1ATR and the stock is not, it's +1 point. If the index is up >1ATR and the stock is up less than half, it's -1 point.
Basic idea (vs the commonly used "relative strength comparison") is that regular relative strength action over a time tells more about accumulaiton than pure price outperformance.
Formula can probably be made better - I'm open to suggestions...
